At DockerCon EU 18 I held a tech talk about monitoring Docker containers in swarm mode. Since the talk was only 20 minutes, it was not possible to cover all the interesting detail. This article provides some additional information and a tutorial for setting up a simple monitoring infrastructure for swarm mode. You can jump directly to the tutorial here.
Having organized logging will help you monitor and troubleshoot your systems faster and with more confidence. Good logging will help you no matter if you run containerized applications as or non containerized application.
The default logging setup in Docker swarm mode does provide a good starting point. But we can improve it a lot by setting up additional infrastructure.
When a system is running the load will fluctuate, the services will become slower or faster as the system evolves. But unless we monitor the numbers, we will not be able to see trends and proactively solve problems.
Some crucial aspects to monitor are
Response time on critical operations
Amount of requests to services
Server utilization(memory, disk, CPU)
It is vital to be alerted when anything unexpected happens like a disk running low on space or response time from a service peaking.
Monitoring allows us to scale servers before the load gets to high. Notify developers that their changes impacted performance. Add more disk space before the service breaks down. It allows us to sleep better at night knowing that we are alerted before a problem impacts production.
Something is bound to go wrong in any application, at some point! When errors happen, logs are needed to see the error message and figure out what caused the problem.
In many cases, the error message does not tell a complete story of the error by itself. Instead, we need to correlate the error messages from multiple servers to piece together the interaction the user had with our application leading up to the error.
If no special attention is given to logging, usually what happens is: Our systems start small, and we do not think about logging. We can easily understand the whole system, the few times we need access to log data, we just log in to the server and view the information. As our system grows with more replicas for each service and more servers, it gets increasingly painful to do that.
Also, the log format from different services is in various formats. Making it mentally challenging to correlate in a stressful environment trying to fix an error.
But we can do better to make it easier and gain more value from our log data.
Docker containers should adhere to the single responsibility principle. It essentially means that a container should only run a unique process.
The main process in the container writes all the log data to console in the STDOUT and STDERR pipes. If you use the command:
docker logs -f <containerid>
you will be able to see how it looks.
This example is from an NGINX web server; it outputs its access log to the console.
This first step with docker logging does not solve any of the problems, each service still just logs to the local server it is deployed on. But docker swarm builds on the concept to improve on it.
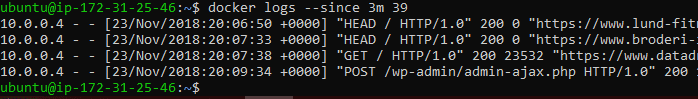
A Docker Swarm consists of some nodes, and the services are replicated and spread across the nodes. One of the cool things about swarm is that logs are centralized to the management nodes.
All the replicas report logging back to the management nodes which allows us to view an aggregated log from across all the replicas.
The example here is from an NGINX web server with two replicas. If you compare the output to the example above additional information is prepended to each line, the IP of the host and the container identifier. The information is added by swarm to allow us to identify where the log data originates from.
It slightly improves the troubleshooting situation, but we still need to view a large amount of log data on the screen and correlate it across services to pinpoint problems. Making the job less than optimal.
To further improve the logging, we need to collect all logs to a centralized location to make both monitoring and troubleshooting easier.
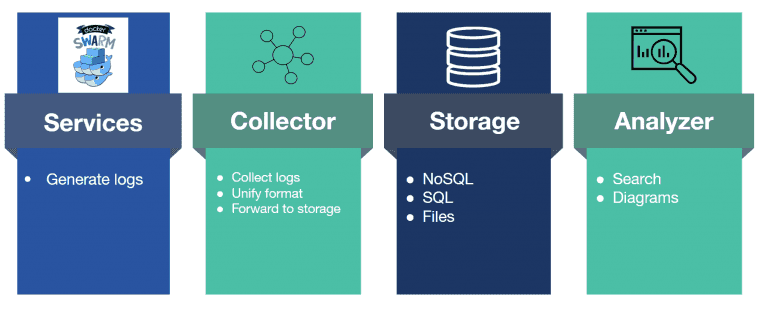
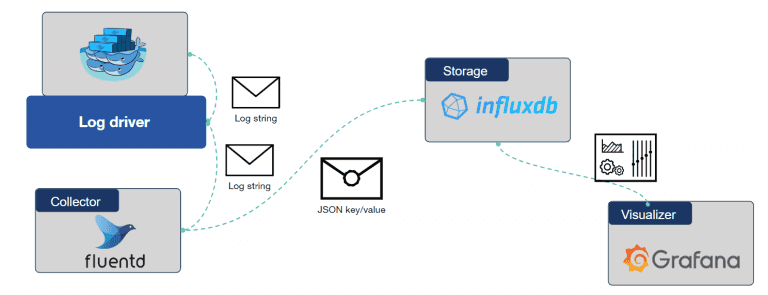
Such a setup consist of four components as shown here.
Services the service stack swarm that generates logs
Collector a services that gather all the log data transforms it into a unified format and forwards it to a storage system.
Storage: The place where we store the log data. It can be any type of storage as long as it allows us to access it easily. Everything from highly advanced NoSQL indexing systems to flat files can be used, depending on our needs. Even combinations are often used.
Analyzer: The software used to search and view the log data. Most analyzers also support alerting so we can get notified when errors happen without us actively looking at the dashboards.
I admit it, this stack of services, just for logging, is way more complicated than just writing data to flat files, directly on the server. But it will give us superpowers with our log data, so the added complexity is worth it.
Each of the services has many different options, and the combinations are almost endless, not allowing us an easy choice of components.
The easy choice is to use one of the popular stacks like the ELK(Elasticsearch, Logstash, Kibana) or TICK(Telegraf, InfluxDB, Chronograf, Kapacitor). But other options are also available.
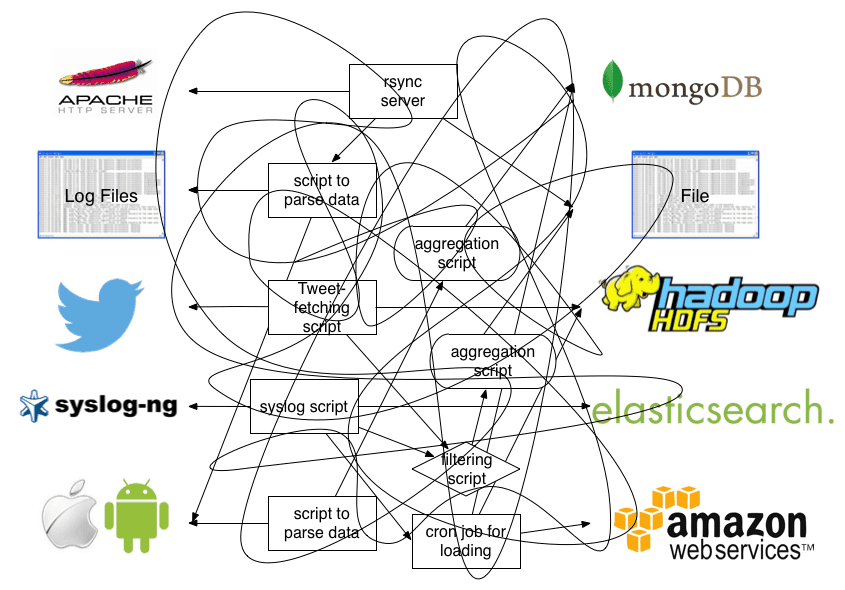
The purpose of any collector is to act as a bridge between our log generating services and our storage system. Without a centralized collector we usually end up with a huge mess where there are custom scripts to parse log data, not all data can be piped to all the needed storage systems.
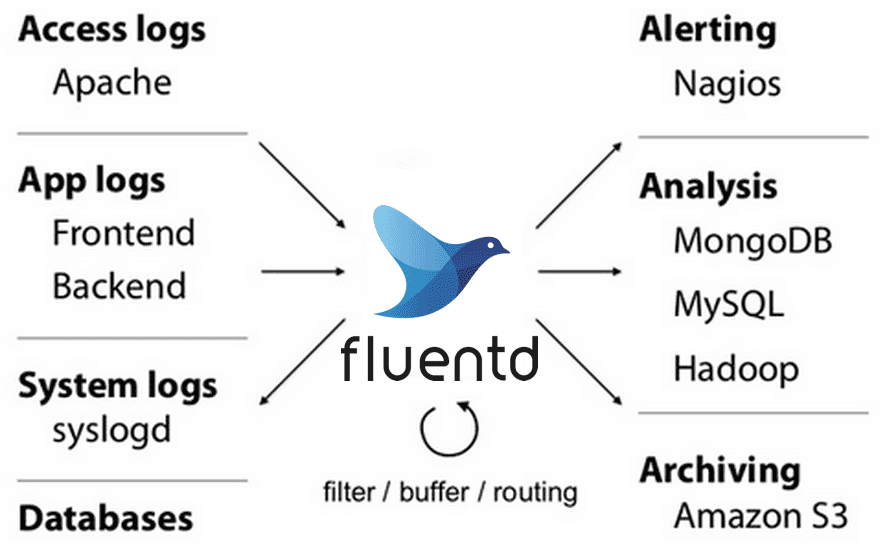
That is the situation fluentd sets out to solve. It can accept data from almost any source and output to a large number of systems you are not limited to output all data to a single source. With fluentd, you can have critical errors logged to slack or email to have instant awareness of errors.
Fluentd excels in taking logs formatted as text and parse them into JSON format. The now structured data can then be forwarded into storage for further processing.
InfluxDB is a time series database. It is designed for handling a large amount of time-structured data. It features an SQL like query language that will be familiar if you have used SQL.
When dealing with log data, in most cases the newest data will be more relevant and essential than older data. InfluxDB supports retention policies to help us manage the data. We can set it up to automatically aggregate the data as it ages, and only keep the newest data in full resolution. It helps us manage the space requirement of the log data.
Grafana is a great tool to visualize data. It excels in plotting graphs and setting up threshold values to give automatic alerts. You can set up any amount of dashboards to allow fine-grained monitoring of your systems.
It can read data from many different data sources, which means that you are by no means locked to InfluxDB, and they can even be combined if you need data from various sources.
Grafana’s is built for visualizing data, which means that it is not useful for searching in log data to troubleshoot. There is no built-in way to explore the data. But its strong point is that dashboards and graphs can be set up using the interface, no mocking around in config files are needed to begin using it.
A logging flow creates a pipeline from the docker containers, through fluentd and into InfluxDB. Every log message is passed this way through.
When a log message is created inside the container, it is passed to the log driver. It is a component inside Docker. We will configure this component to forward the message to the collector. When fluentd receives the message, it will parse it into JSON format and forward it to InfluxDB for storage.
And last, Grafana can query the data in InfluxDB to visualize it using its dashboard functionality.
The logging driver is the service in Docker that allows us to get log data out of a container. One thing to be aware of is that it runs as an infrastructure component inside Docker, so it does not have direct access to the same mesh network that our service stack uses. It means that it will not be able to publish log messages to the fluentd instance running inside the service stack unless fluentd’s port is published.
The easiest way to try out the setup is to use Play with Docker it provides a web interface to a Linux server where you can start Docker containers and try out the setup. It will allow sessions of 4 hours, enough to test stuff out.
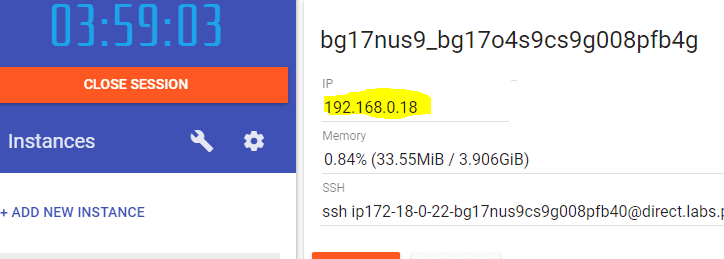
First, you need a new instance to work with, when you create that you get a console.
At the top, you can see the IP address of the instance.
First, we need to initialize our swarm
docker swarm init –advertise-addr=<ipaddress of the instance>
Next step is to deploy the service stack; you can find an example docker-compose.yml file here
version: "3.2"
services:
webserver:
image: nginx
ports:
- "8080:80"
logging:
driver: fluentd
options:
fluentd-address: 127.0.0.1:24224 # this is the port published by the fluentd service below
fluentd-async-connect: 1
tag: httpd.nginx
fluentd:
image: papirkurvendk/fluentd-influxdb
volumes:
- fluentd:/fluentd/log
ports: # needs to be exposed for the logging driver to have access
You can add this to the instance by using the command
cat > docker-compose.yml
Copy the data into the console. End with Ctrl + C. Next step is to start the service stack
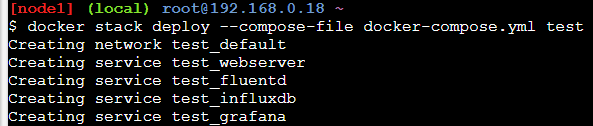
docker stack deploy —compose-file docker-compose.yml test
Now you should see output like this, showing that the services are started.
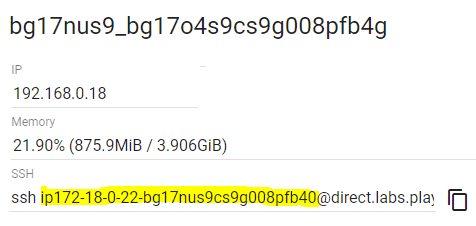
You should be able to access the website by clicking the port number link at the top of the interface. Sometimes they do not show up, but you can create the URL manually. You need the part marked with yellow below. It is added into the URL below. When you get it right, it should show the “Welcome to Nginx!” message from the website.
If you look in details on the docker-composer.yml file, you will see that there are options for logging on the web server service. It is set up to deliver log data to fluentd on 127.0.0.1:24224
But if you run the following command, you will see that the fluentd container keeps restarting.
docker ps
It happens because it can not find the database in InfluxDB because we have not created it yet, as seen by viewing the logs from the container.
Now you should see that the fluentd container keeps running. And now data is being stored in the InfluxDB database automatically.
The final step is to log in to Grafana and configures it to display the data. You use the same URL that you created to access the website, just exchange the 8080 with 3000. That is the port number we are replacing.
It should give you the login page for Grafana
Login using admin/admin, it will ask you for a new password.
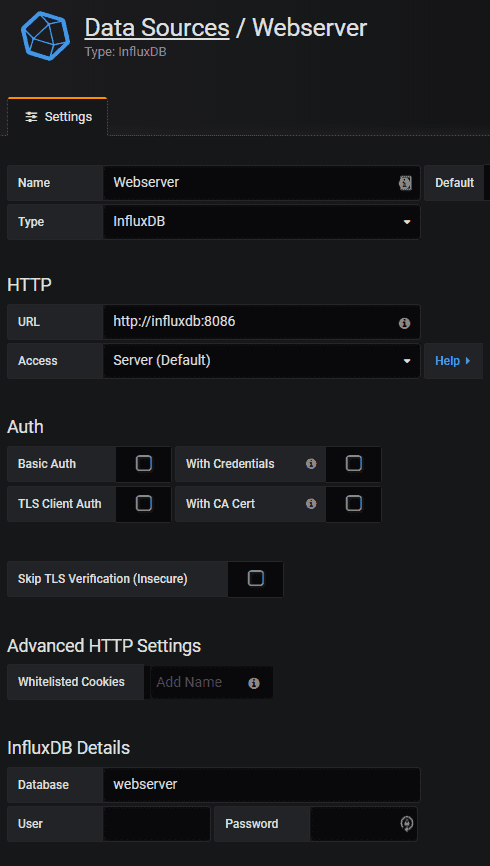
The first thing we need to do is to add a data source, so Grafana knows where our data is located. We enter http://influxdb:8086 as the URL and “webserver” as the database name as shown below.
Grafana should respond that the data source works.
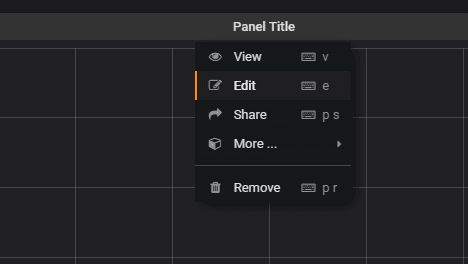
Now we can create a graph of the stored data. On the left side of Grafana is a plus where we can add a dashboard and on the dashboard we can add a graph.
It should create an empty graph which we can edit on the top arrow.
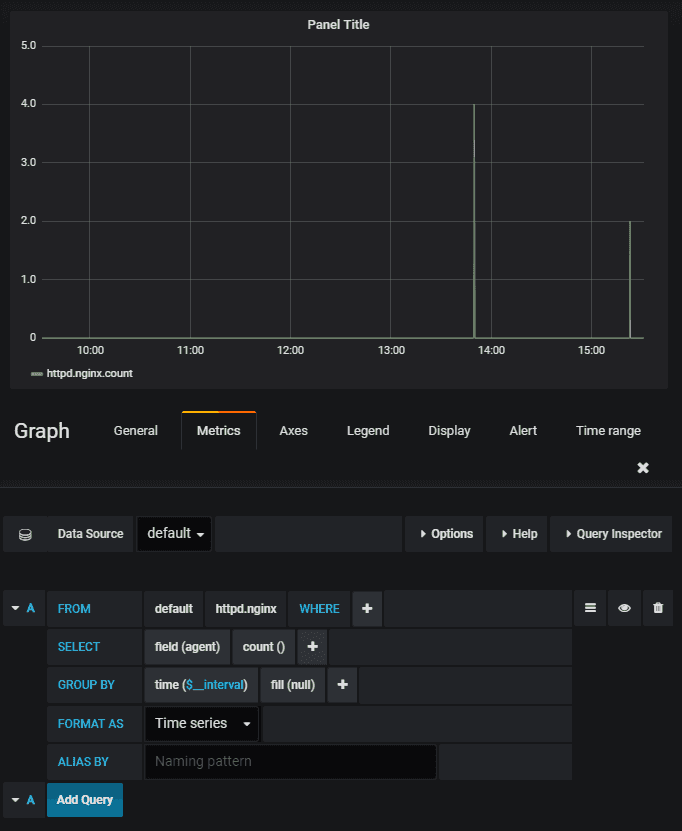
Edit the query to match the settings here
Now you will have a live updating graph counting the number of requests the Nginx container is processing. You can use this as a template to add more graphs.
It will depend a lot on your needs which graphs that are important to your setup.
I hope this article will inspire you to add more monitoring into your Docker set up. It takes a bit of effort to master it, but it will add tremendus value. If you have any questions or something is unclear, feel free to leave a comment, then I will try to clarify.
I teach developers how to improve the code they write. I focus on how they can implement clean code and craftsmanship principles to all aspects of their code.