We do not log in to our servers every day to check how the resource usage is. Just like with uptime monitoring we need a system to help us monitor if everything is inside reasonable limits so we can scale the servers if required. And detect any potential problem before it becomes a problem.
In this article, I will explore how to set up monitoring using, Docker, influxdb, grafana, cAdvisor, and fluentd.
I used this excellent article by Hanzel Jesheen as the starting point for my monitoring setup. It explains how to setup influxdb, grafana and cAdvisor. If you follow that guide, you will have a great starting point.
Monitoring Docker containers
We need to know how much CPU, memory, and disk usage each container and Docker host consumes. That information is collected by cAdvisor. Which is a project by Google:
cAdvisor (Container Advisor) provides container users an understanding of the resource usage and performance characteristics of their running containers.
It runs as a container on each Docker host, it then gathers the data and pushes it into influxdb.
Setting up cAdvisor is easy, I just added the following to my docker-compose.yml file
cadvisor: image: google/cadvisor hostname: ’{{.Node.ID}}’ command: -logtostderr -docker_only -storage_driver=influxdb -storage_driver_db=cadvisor -storage_driver_host=influx:8086 volumes:
- /:/rootfs:ro- /var/run:/var/run:rw- /sys:/sys:ro- /var/lib/docker/:/var/lib/docker:rodeploy:mode: global
It has “deploy mode” set to “global” to make sure it runs on all our Docker hosts. It also has to know where the influxdb instance is running; this is provided by the parameter -storage_driver_host=influx:8086
Then it needs access to some Docker specific files so it can collect stats. And that is the only thing required. When running, each cAdvisor instance consumes ~40MB on my setup.
Influxdb
Influxdb is a time series database; it is built with only this purpose in mind. So it supports some neat features needed when working with time series. For example, it has retention policy support, meaning that if you do not need old data, you can set an expiry date on it.
Influxdb uses a SQL like, query language to get data. If you had any exposure to SQL, you should find it quite easy to work with.
An example of the query I use to show the average response times for Nginx:
SELECT mean(“request_time”) FROM “autogen”.“httpd.loadbalancer” WHERE $timeFilter GROUP BY time($__interval) fill(null)
Very similar to SQL.
Setting up influxdb is also just an entry into the docker-compose.yml file:
influx: image: influxdb volumes:
- influx:/var/lib/influxdbdeploy:placement:constraints:- node.role != managerresources:limits:memory: 350M
Influxdb is memory hungry, so I added a memory limit of 350MB which has been working out fine for me. It usually uses around 250MB, so there is room to spare if it needs more memory.
The data collected in influxdb is not super relevant to me, so I have not added any backup routine to it. If it crashes and I loos the data it is not that big a deal.
The last piece of the puzzle for monitoring the hardware is grafana which will do the actual visualizations.
It is similarly easy to set up. Just add an entry into the docker-compose.yml file:
grafana: image: grafana/grafana ports:
- 0.0.0.0:3000:3000volumes:- grafana:/var/lib/grafanadeploy:placement:constraints:- node.role == manager
You can see in the article mentioned earlier how to set up grafana once it is deployed.
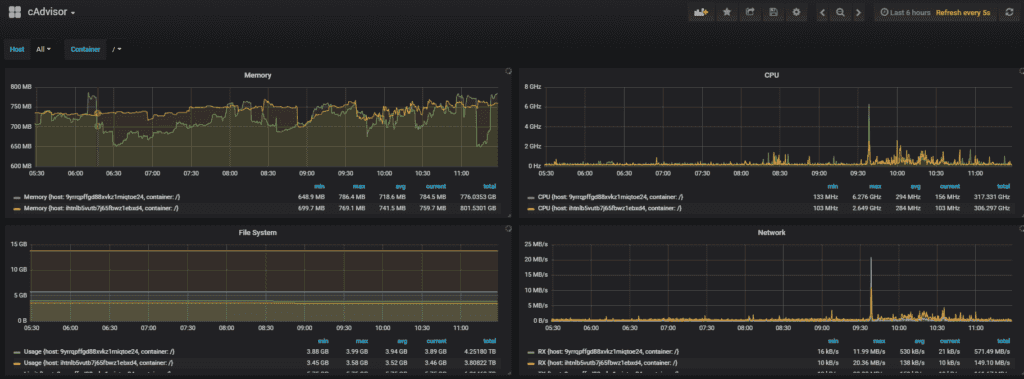
It will give a dashboard like this:
It shows RAM, Disk, CPU, and network usage. It allows us to see it per Docker host or container. Which is all I need to be able to monitor the health of the nodes.
Monitoring Nginx log files
Since the setup run websites, it is essential to monitor the log data from Nginx. Luckily, Docker supports a logging system that allows us to centralize the log data. It has many different drivers; I am going to use fluentd, it is easy to configure and use.
With Docker, you can run the command docker <containerid> logs and then it will show you the log data for that container. But that is not very useful when we want to analyze the data. The log drivers in Docker allows us to send the log text to a service instead. Which will enable us to centralize the log information.
It can be setup using the docker-compose.yml file again.
loadbalancer:.....logging:driver: fluentdoptions:fluentd-address: 127.0.0.1:24224 # see info on fluentd container - mesh network will route to the correct hostfluentd-async-connect: 1 # if the fluentd container is not running, just buffer the logs until it is availabletag: httpd.loadbalancerfluentd:image: 637345297332.dkr.ecr.eu-west-1.amazonaws.com/patch-fluentd:latestports: # needs to be exposed for the logging driver to have access, it is firewalled to deny outside access- "24224:24224"- "24224:24224/udp"
A container running fluentd service is needed. It has the port 24224 exposed. Then the load balancer logging system is configured to point to fluentd. Each log line that is sent to fluentd is tagged with the tag “httpd.loadbalancer” this allows us, inside fluentd to configure what to do with the loglines from this service.
Notice that the logging system in Docker does not run inside the same network as the services themselves, so for the load balancer service to send logging statements to the fluentd service, the ports need to be mapped to allow external access. This is the reason that the load balancer points to 127.0.0.1. But the fluentd service and the load balancer services do not need to run on the same Docker host, because the routing mesh will make sure the data is sent to the correct container. Please use a firewall to make sure fluentd is not accessible from outside.
Fluentd needs the influxdb plugin to be able to send data to influxdb. It can be accomplished using this Dockerfile
FROM fluent/fluentd:v0.14-onbuildMAINTAINER Frederik Banke frederik@patch.dkRUN apk add --update --virtual .build-deps \\sudo build-base ruby-dev \\&& sudo gem install \\**fluent-plugin-influxdb \\**fluent-plugin-secure-forward \\&& sudo gem sources --clear-all \\&& apk del .build-deps \\&& rm -rf /var/cache/apk/\* \\/home/fluent/.gem/ruby/2.3.0/cache/\*.gemEXPOSE 24284
And finally, we need a config file to translate the log data from the load balancer. Because I use a different kind of log format than the standard Nginx format, it needs a special setup in fluentd to parse it. It is accomplished using regex inside fluentd.
As shown here:
<source>@type forward</source><filter httpd.*>@type parserkey_name log<parse>@type regexpexpression /\[(?<logtime>\[^\]\]*)\] (?<remote_addr>[^ ]*) - (?<remote_user>[^ ]*)- - (?<server_name>[^ ]*) to: (?<upstream_addr>[^ ]*): (?<type>[^ ]*) (?<request>[^ ]*) (?<protocol>[^ ]*) upstream_response_time (?<upstream_response_time>[^ ]*) msec .*? request_time (?<request_time>[^ ]*) upstream_status: (?<upstream_status>[^ ]*) status: (?<status>[^ ]*) agent: "(?<user_agent>.*)"$/time_format %d/%b/%Y:%H:%M:%S %ztime_key logtimetypes request_time:float,upstream_response_time:float</parse></filter><match *>@type stdout</match><match *.*>@type influxdbdbname nginxhost influx<buffer>flush_interval 10s</buffer></match>
The article by Doru Mihai about fluentd regex support was a great help.
The first <source> tells fluentd that it should accept all incoming data and forward into the processing pipeline.
The <filter> element matches on tags, this means that it processes all log statements tags that start with httpd. And in our case, the tag name is “httpd.loadbalancer”.
The first <match> statement matches all statements tagged with any other tags and writes it to standard output in fluentd.
The second match statement process all tags with the format <anything>.<anything> and writes it to influxdb.
With data available in influxdb we can create a dashboard in grafana to display the data.
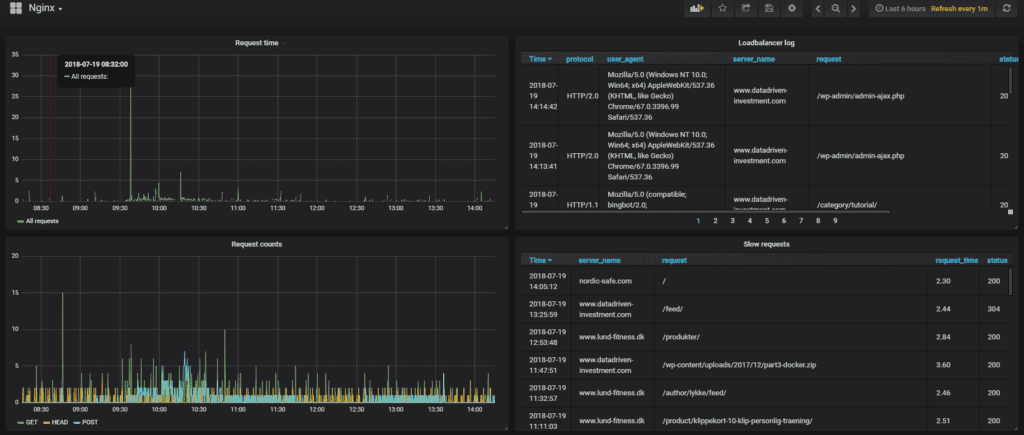
I want to show the following information: A raw log with all requests, the HTTP response code, and timings both from the load balancer and the upstream servers. I also want to show a graph of the number of requests, divided into the request type GET/POST/HEAD. I also want a graph showing the average response time. And finally, I want a table collecting all “slow requests” for me that is any request that took more than 2 seconds to process.
This dashboard looks like this:
Conclusion
The setup is easy to extend, any log data from any Docker container can be added to fluentd and processed into influxdb and grafana. It makes it easy to add any kind of graphs to the dashboards at a later time.
Share
Related Posts
Legal Stuff


